Rosemont Center School
- Grades: 1-12
- Student Enrollment: 44
Familiar With This School? Help Others By Posting Your Review
- Address
- 2440 Dawnlight Ave
- Columbus, OH 43211
- Phone
- (614) 471-2626
Find Old Friends From Rosemont Center School
Use the form below to search for alumni from Rosemont Center School.
School Description
Rosemont Center School enrolls 44 elementary, middle, and high school students from grades 1-12. It is located in Columbus, OH, which is a highly populated city with a median household income of $37,897.
School Operational Details
- Alternative School
- Students Have Access to a Library or Media Center
School Days and Hours
- School Days Per Year: 180
- School Hours Per Day: 4
School Associations
- Other school association(s)
Similar Schools Nearby
| Tree of Life Christian School-Northridge PK-12 | 684 Students | 2.9 miles away | Not Yet Rated | - |
| St Francis De Sales High School 9-12 | 921 Students | 2.9 miles away | Not Yet Rated | - |
| St Charles Preparatory School 9-12 | 608 Students | 3.5 miles away | Not Yet Rated | - |
Compare Nearby Schools ->
Click To Activate School Map
This School
Public
Private
School Ratings and Reviews
Be The First To Review Rosemont Center School!
Help others in the community find the best school for their children by rating this school and writing a detailed review of your experiences.
Faculty Details and Student Enrollment
Students and Faculty
- Total Students Enrolled: 44
- Total Full Time "Equivalent" Teachers: 2.0Full-Time Teachers: 2
- Average Student-To-Teacher Ratio: 22.0
- Percent Minority Students: 54.5%
Students Gender Breakdown
- Males: 9 (20.5%)
- Females: 35 (79.5%)
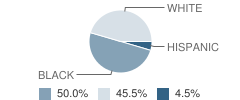
Student Enrollment Distribution by Race / Ethnicity

| Number | Percent | |
|---|---|---|
| American Indian | - | - |
| Black | 22 | 50.0% |
| Asian | - | - |
| Hispanic | 2 | 4.5% |
| White | 20 | 45.5% |
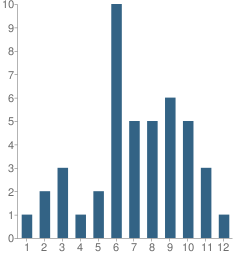
Number of Students Per Grade

| Number | Percent | |
|---|---|---|
| 1st Grade | 1 | 2.3% |
| 2nd Grade | 2 | 4.5% |
| 3rd Grade | 3 | 6.8% |
| 4th Grade | 1 | 2.3% |
| 5th Grade | 2 | 4.5% |
| 6th Grade | 10 | 22.7% |
| 7th Grade | 5 | 11.4% |
| 8th Grade | 5 | 11.4% |
| 9th Grade | 6 | 13.6% |
| 10th Grade | 5 | 11.4% |
| 11th Grade | 3 | 6.8% |
| 12th Grade | 1 | 2.3% |
Source: OH Department of Education, Source: NCES 2009-2010
Sponsored Links
Navigation
Can't Find What You Are Looking For?
K-12 Articles

When Bad Report Cards Happen to Good Kids
It’s mid-term season once again, and semester (or quarter or trimester) grades will be coming out...
It’s mid-term season once again, and semester (or quarter or trimester) grades will be coming out...

Keep Your Licensed Teen Safe This Summer
Every year hundreds of teenage drivers lose their lives in motor vehicle accidents. Statistics show...
Every year hundreds of teenage drivers lose their lives in motor vehicle accidents. Statistics show...

Idle Hands
The worst affliction affecting our kids today is not teen pregnancy, drugs and alcohol, or...
The worst affliction affecting our kids today is not teen pregnancy, drugs and alcohol, or...
Get School Listings On Your Site
- The Widget Offers:
- - Searching By City or Zip
- - Public & Private Schools
- - School Ratings & Grades
- - Simple Embedding Code
- Great For:
- - Real Estate Blogs
- - Education or School Blogs
- - School Websites

