Challenge & Development Center / Feliciana Alternative School
- Grades: 6-10
- Student Enrollment: 26
Familiar With This School? Help Others By Posting Your Review
- Address
- 11325 Liberty St
- Clinton, LA 70722
- Mailing Address:
- PO Box 8469
- Clinton, LA 70722
- Phone
- (225) 683-6751
Find Old Friends From Challenge & Development Center / Feliciana Alternative School
Use the form below to search for alumni from Challenge & Development Center / Feliciana Alternative School.
School Description
Challenge & Development Center / Feliciana Alternative School enrolls 26 middle and high school students from grades 6-10. It is located in Clinton, LA, which is a medium sized city with a median household income of $27,016.
School Operational Details
- Alternative School
- Enrolls Only Male Students
School Days and Hours
- School Days Per Year: 238
- School Hours Per Day: 7
School Associations
- Other school association(s)
Similar Schools Nearby
| Silliman Institute School PK-12 | 467 Students | 0.4 miles away | Not Yet Rated | - |
| Trinity Christian Academy 4-12 | 31 Students | 17.3 miles away | Not Yet Rated | - |
| Central Private School KG-12 | 447 Students | 21.1 miles away | Not Yet Rated | - |
Compare Nearby Schools ->
Click To Activate School Map
This School
Public
Private
School Ratings and Reviews
Be The First To Review Challenge & Development Center / Feliciana Alternative School!
Help others in the community find the best school for their children by rating this school and writing a detailed review of your experiences.
Faculty Details and Student Enrollment
Students and Faculty
- Total Students Enrolled: 26
- Total Full Time "Equivalent" Teachers: 3.0Full-Time Teachers: 3
- Average Student-To-Teacher Ratio: 8.7
- Percent Minority Students: 53.8%
Students Gender Breakdown
- Males: 26 (100.0%)
- Females: - (-)
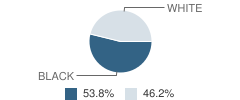
Student Enrollment Distribution by Race / Ethnicity
| Number | Percent | |
|---|---|---|
| American Indian | - | - |
| Black | 14 | 53.8% |
| Asian | - | - |
| Hispanic | - | - |
| White | 12 | 46.2% |
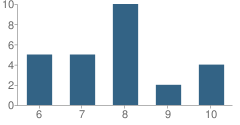
Number of Students Per Grade
| Number | Percent | |
|---|---|---|
| 6th Grade | 5 | 19.2% |
| 7th Grade | 5 | 19.2% |
| 8th Grade | 10 | 38.5% |
| 9th Grade | 2 | 7.7% |
| 10th Grade | 4 | 15.4% |
Source: LA Department of Education, Source: NCES 2009-2010
Sponsored Links
Nearby Cities
Navigation
Can't Find What You Are Looking For?
K-12 Articles

Teaching Children Respect
Statistics prove that there are many different family types in today’s society. Grandparents or a...
Statistics prove that there are many different family types in today’s society. Grandparents or a...

The Impact on Adopted Children at School
Children who are adopted can be affected both academically and socially at school. Many times...
Children who are adopted can be affected both academically and socially at school. Many times...

A Cheat Sheet on Cheating
Senior projects are coming due and finals are coming up. Spring has sprung, and with spring comes...
Senior projects are coming due and finals are coming up. Spring has sprung, and with spring comes...
Get School Listings On Your Site
- The Widget Offers:
- - Searching By City or Zip
- - Public & Private Schools
- - School Ratings & Grades
- - Simple Embedding Code
- Great For:
- - Real Estate Blogs
- - Education or School Blogs
- - School Websites
