Anova Center for Education School
- Grades: 1-12
- Student Enrollment: 53
Familiar With This School? Help Others By Posting Your Review
- Address
- 3033 Cleveland Ave Ste 240
- Santa Rosa, CA 95403
- Mailing Address:
- 1142 State Farm Dr
- Santa Rosa, CA 95403
- Phone
- (707) 527-0183
Find Old Friends From Anova Center for Education School
Use the form below to search for alumni from Anova Center for Education School.
School Description
Anova Center for Education School enrolls 53 elementary, middle, and high school students from grades 1-12. It is located in Santa Rosa, CA, which is a highly populated city with a median household income of $50,931.
School Operational Details
- Special Education
School Days and Hours
- School Days Per Year: 220
- School Hours Per Day: 6
Similar Schools Nearby
| North Valley School 4-12 | 65 Students | 0.8 miles away |  5 out of 5 | - |
| Stuart Preparatory School KG-9 | 40 Students | 1.9 miles away | Not Yet Rated | - |
| Cardinal Newman High School 9-12 | 434 Students | 1.9 miles away | Not Yet Rated | - |
Compare Nearby Schools ->
Click To Activate School Map
This School
Public
Private
School Ratings and Reviews
Be The First To Review Anova Center for Education School!
Help others in the community find the best school for their children by rating this school and writing a detailed review of your experiences.
Faculty Details and Student Enrollment
Students and Faculty
- Total Students Enrolled: 53
- Total Full Time "Equivalent" Teachers: 5.0Full-Time Teachers: 5
- Average Student-To-Teacher Ratio: 10.6
- Percent Minority Students: 11.3%
Students Gender Breakdown
- Males: 47 (88.7%)
- Females: 6 (11.3%)
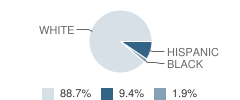
Student Enrollment Distribution by Race / Ethnicity
| Number | Percent | |
|---|---|---|
| American Indian | - | - |
| Black | 1 | 1.9% |
| Asian | - | - |
| Hispanic | 5 | 9.4% |
| White | 47 | 88.7% |
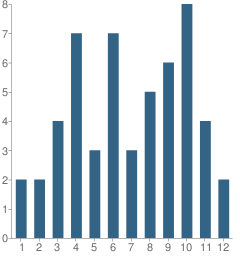
Number of Students Per Grade
| Number | Percent | |
|---|---|---|
| 1st Grade | 2 | 3.8% |
| 2nd Grade | 2 | 3.8% |
| 3rd Grade | 4 | 7.5% |
| 4th Grade | 7 | 13.2% |
| 5th Grade | 3 | 5.7% |
| 6th Grade | 7 | 13.2% |
| 7th Grade | 3 | 5.7% |
| 8th Grade | 5 | 9.4% |
| 9th Grade | 6 | 11.3% |
| 10th Grade | 8 | 15.1% |
| 11th Grade | 4 | 7.5% |
| 12th Grade | 2 | 3.8% |
Source: CA Department of Education, Source: NCES 2009-2010
Sponsored Links
Nearby Cities
Navigation
Can't Find What You Are Looking For?
K-12 Articles

Teaching Your Kids About Respect, Values and Violence
These days it seems that every newscast reports at least once incident of violence. As parents, we...
These days it seems that every newscast reports at least once incident of violence. As parents, we...

Internet Safety for Kids of All Ages
Kids are being introduced to the Internet at a very young age. Research for homework and school...
Kids are being introduced to the Internet at a very young age. Research for homework and school...

Public or Private?
Daniel attended private school until sixth grade, when he was diagnosed with Asperger’s Syndrome, a...
Daniel attended private school until sixth grade, when he was diagnosed with Asperger’s Syndrome, a...
Get School Listings On Your Site
- The Widget Offers:
- - Searching By City or Zip
- - Public & Private Schools
- - School Ratings & Grades
- - Simple Embedding Code
- Great For:
- - Real Estate Blogs
- - Education or School Blogs
- - School Websites
