Roosevelt Alternative School
Rating
Not Available
Not Available

3 out of 5 | 2 Reviews
Find Old Friends From Roosevelt Alternative School
Use the form below to search for alumni from Roosevelt Alternative School.
School Description
School Summary and Highlights
- Enrolls 91 high school students from grades 9-12
Additional Contact Information
- Principal or Admin: Janet Simpkins
School Operational Details
- Alternative School
- Title I EligibleAll students of this school are eligible for participation in authorized programs.
School District Details
- Norristown Area School District
- Per-Pupil Spending: $14,214
- Graduation Rate: 76.2%
- Dropout Rate: 5.0%
- Students Per Teacher: 12.9
- Enrolled Students: 6,717
Faculty Details and Student Enrollment
Students and Faculty
- Total Students Enrolled: 91
- Total Full Time "Equivalent" Teachers: 13.0
- Average Student-To-Teacher Ratio: 7.0
Students Gender Breakdown
- Males: 39 (42.9%)
- Females: 52 (57.1%)
Free Lunch Student Eligibility Breakdown
- Eligible for Reduced Lunch: 5 (5.5%)
- Eligible for Free Lunch: 59 (64.8%)
- Eligible for Either Reduced or Free Lunch: 64 (70.3%)
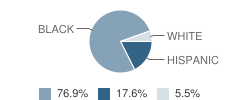
Student Enrollment Distribution by Race / Ethnicity

| Number | Percent | |
|---|---|---|
| American Indian | - | - |
| Black | 70 | 76.9% |
| Asian | - | - |
| Hispanic | 16 | 17.6% |
| White | 5 | 5.5% |
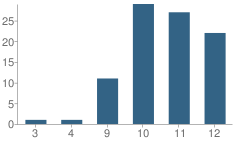
Number of Students Per Grade

| Number | Percent | |
|---|---|---|
| 3rd Grade | 1 | 1.1% |
| 4th Grade | 1 | 1.1% |
| 9th Grade | 11 | 12.1% |
| 10th Grade | 29 | 31.9% |
| 11th Grade | 27 | 29.7% |
| 12th Grade | 22 | 24.2% |
Low-Income Enrollment (2011)
Percent of Students from Low-Income Families
School:
83.3%
District:
69.1%
Graduation and Dropout Rates (2010)
Graduation Rate
School:
51.4%
District:
83.5%
Dropout Rate
School:
31.5%
District:
2.2%
Source: PA Department of Education, Source: NCES 2009-2010
Navigation
Can't Find What You Are Looking For?
Rankings
Nearby Cities
Sponsored Links
K-12 Articles

Educators and Childhood Obesity
Obesity in childhood is rising to epidemic proportions in America and educators should be...
Obesity in childhood is rising to epidemic proportions in America and educators should be...

Keeping Our Kids Safe in the Post 9/11 World
Recently, radio talk show host and CNN personality did a week-long special entitled “The Perfect...
Recently, radio talk show host and CNN personality did a week-long special entitled “The Perfect...

Promoting Childhood Literacy
The number of American adults who are illiterate is astounding. People who lack the ability to read...
The number of American adults who are illiterate is astounding. People who lack the ability to read...


 (1 / 5)
  (5 / 5)